Is your organization data-driven? It’s the year 2021, and if you are an executive, then it may be time to start thinking about what skills will be most beneficial to your company and its future. If you haven’t already done so, now is the time to think about how technology will change the way we work. The rapid pace of technological advancements creates constant pressure on companies that can create significant opportunities as well as threats.
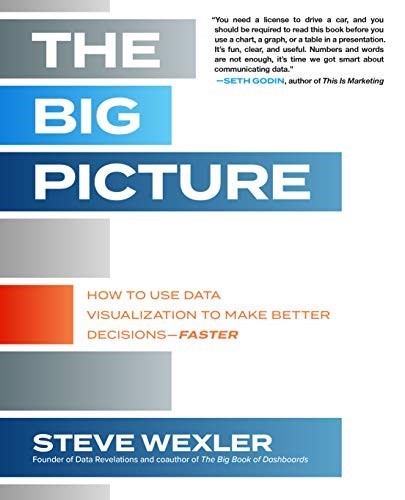
To help executives make sense of these changes, Steve Wexler’s The Big Picture: How to Use Data Visualization to Make Better Decisions Faster shares practical advice and key insights into where companies should focus their attention in order to succeed in this new world using the data they already have. Whether the organization uses Tableau or Power BI, this book is a one-stop resource that empowers you along your data journey.
Read to the end to figure out how you can begin to paint your own big picture with data.
The big picture helps professionals whether you are a CEO, chief marketing officer, chief analytics officer, chief research officer or even a data detective or data expert. It enables business professionals to make critical business decisions based on key insights and to use their data visualizations quickly and effectively.
On Tuesday morning I was interrupted by FedEx. Presented with a package that bore a strange name, I was skeptical and almost sent the courier back, until I spotted McGraw Hill on the packaging. Realizing it was a book, I decided to take it. When I opened it up, I was like a child on Christmas morning. It was Steve Wexler’s The Big Picture: How to Use Data Visualization to Make Better Decisions Fasterand I immediately dove in.

LESLIE LEE FOOK & STEVE WEXLER AT THE ARTHUR LOK JACK GRADUATE SCHOOL OF BUSINESS
Steve Wexler is no stranger to data visualization or data visualization consultancy in both academic and professional contexts and provides essential data literacy lessons through his publications. These insights help business professionals achieve their data goals. Just like his previous book, The Big Book of Data Dashboards, this new publication contributes to the global data culture to transform data into insights that can assist every business leader and inspire next generation leadership. It is apparent that Steve Wexler’s passion is promoting graphical literacy and helping everyone to become a data expert and transform data into solutions.
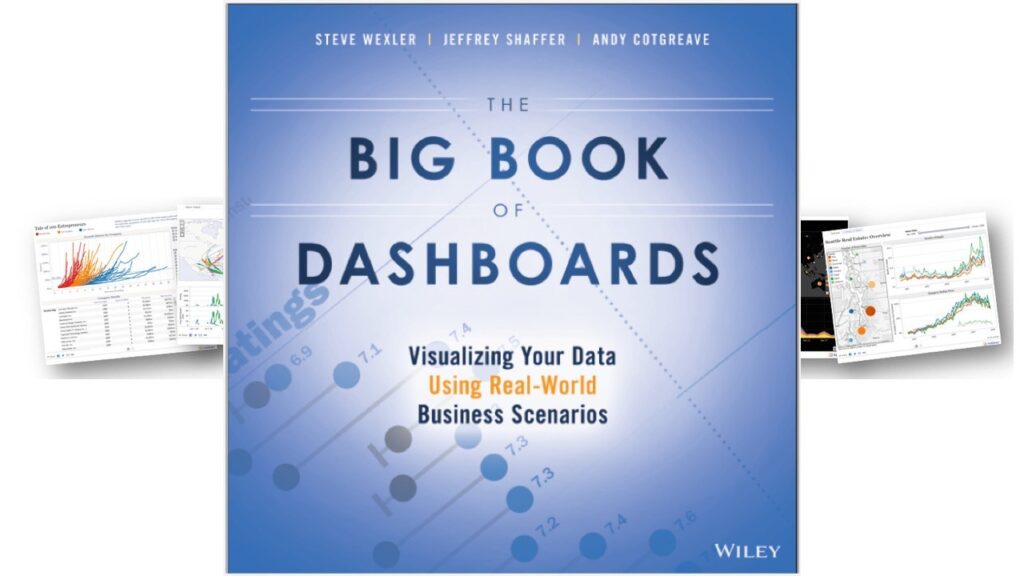
STEVE WEXLER’S LAST PUBLICATION, THE BIG BOOK OF DASHBOARDS
Steve Wexler’s book resonated with me on so many levels as he identified problems and proposes methods to solve problems that are common in the data visualization stratosphere that I have often encountered and tried to articulate to workshop attendees, clients, and everyone who needed to use their data better. My excitement at the concept of this book immediately transferred to my interaction with its content. Wexler communicates with readers at any level they enter his book making data accessible and begins with a call to change the ways they look at data. Yes, we have the numbers on spreadsheets, but so what?
Wexler encourages his readers to look not at the figures themselves but learn to speak to/with the data, that is to practice graphical literacy. He highlights the importance of being able to decipher our data after it has been visualized. Thereby turning spreadsheets into solutions. This process effectively turns visualization from representation into intelligent conversations, one that begins with Steve Wexler and his reader and continues between the reader and his/her data.
Steve continues by engaging and entertaining guide by inviting his readers to consider more nuanced ways of examining data and conducting visualization and analysis that proves to be suitable for both the data analytics virgin and the Excel expert. From the arrangement of charts to the use of color, Wexler illustrates through his own work how to take your data from uninteresting, to intriguing.
He also delves into the importance of storytelling with our numbers and demonstrates that beautiful graphs can be created not only for those who are trained in visualization but by anyone willing to do a little bit of learning. Communicating data effectively is key in today’s world.
Wexler has created a book that is not only an educational guide but also satisfies the need for storytelling. The author’s engaging conversational style makes this an enjoyable read while still providing valuable insights about how we can take what is often considered boring data and transform it into a story that can be shared to derive deeper insight. More importantly, it’s a guide to constructing a narrative of improvement and corporate transformation for organizations that apply these strategies.
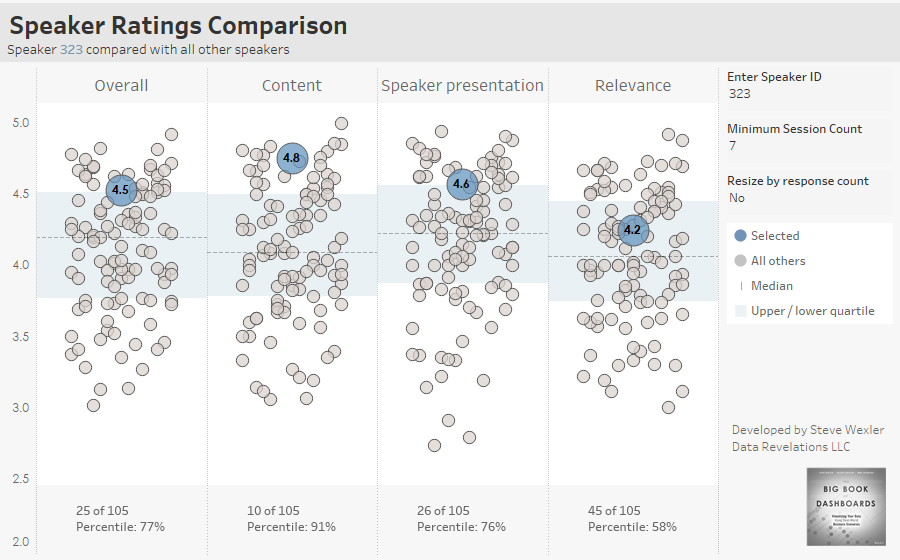
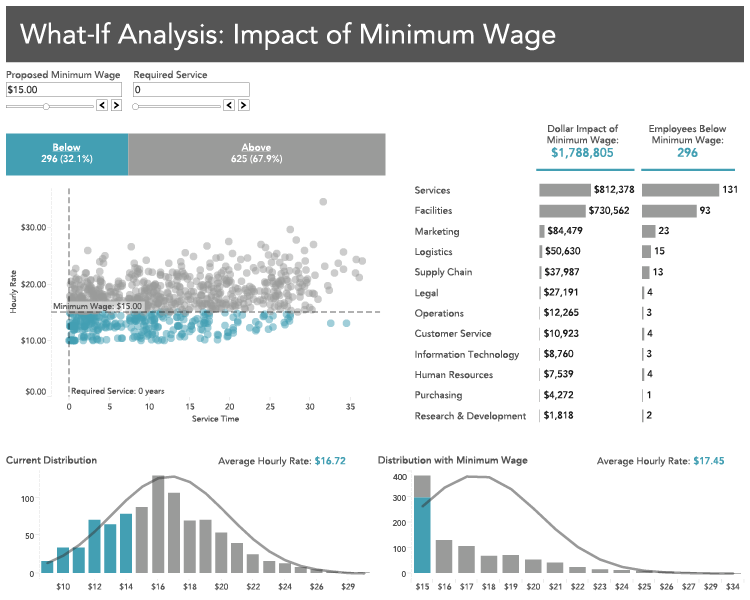
To contextualize the nuggets of wisdom throughout this book, Wexler’s use of real-world data driven cases is a welcome addition. The book presents examples that are related to the data analysis techniques he discusses, which helps readers to better understand the purpose behind his visualization and interpretational techniques.
This allows the reader to see how these strategies can be applied in their own work-related scenarios and to help them uncover issues that previously went unnoticed or unresolved due to the poor application of data to persistent problems.
The fleeting nature of time is always a concern to those who analyze data. When presented with raw data countless hours are spent cleaning, creating, and comparing data sets. This is where Wexler’s book offers a much-needed solution to the woes of analytical professionals everywhere- he helps them make sense out of seemingly endless nights spent with their noses buried in spreadsheets.
He also debunks the myth that the tasks involved in data analysis are to be done in isolation. He gently nudges the reader to be open to opportunities for collaboration not just to make task completion easier but for the insight that multiple perspectives can bring to the process of interpretation.
The book is clearly written and accessible to any high-school graduate. It offers a guide for the beginner in data visualizations while also including aspects of theory that will interest more seasoned professionals. Wexler has managed, in his short expository text, to rekindle enthusiasm for an industry which on the one hand is often viewed as tedious yet on the other hand is key to understanding greater patterns in society.
This is a good book for every data scientist and business professional looking to improve their ability to understand the true story behind spreadsheets. I often see so many instances of data scientists who can see the trends but cannot adequately convey the implications of this content from their graphs and dashboards. It enables business leaders to engage in effective interpreting and drawing insights from
Wexler’s book has found its niche in these moments. It teaches us to not be focused on the numbers and what they represent in spreadsheets and bar graphs but rather on the big picture that these numbers paint to influence critical business decisions.
Steve Wexler delivers his titular promise of providing solutions to using data in a faster and better way and guides you along the process of building solutions in the aftermath of building data dashboards. In the spaces between words, Wexler beckons to the reader, “Come along, and paint your own big picture. I will show you how.”
To start creating your own big pictures with data, check out Steve Wexler’s The Big Picture.