Businesses rely on the insight data scientists provide to drive decisions from daily operations to large-scale processes.
In this article, we explain which certifications can help data scientist increase their industry knowledge, gain experience, and add value to their skill set.
We will also explain how these certifications can be used to increase your industry knowledge and give you a competitive edge.

A data scientist is an analyst who gathers and uses information to help optimize business processes. They investigate big data for patterns and insights, combining IT and business knowledge to find trends.
Data scientists use strong communication skills to share insights with team members, from IT to marketing and top-level management and they must have in-depth knowledge of coding and statistical computer languages, computing tools and data presentation software.
Data scientists are becoming increasingly popular in today’s world with the rise of big data and analytics. As more business intelligence tools are developed to help make sense of larger volumes of data, demand for skilled professionals with these abilities is expected to grow rapidly in coming years.
Data science certifications will teach you how to extract meaningful insights from large datasets by combining IT skills like coding, programming and statistical analysis with knowledge about specific industries such as finance or healthcare.
The certification process helps ensure that individuals have the required technical competencies as well as knowledge of relevant areas within their field.
There are many different types of certificates available on Coursera including certificates from Rice University’s Department of Statistics & Data Science (DS&DS).
Certifications are a great way to gain an edge because they allow you to develop skills that are hard to find in your desired industry.
They’re also a way to validate your skills, so recruiters and hiring managers know what they’re getting if they hire you.

Being a certified data scientist gives a distinctive edge among the competition.
Also, it is an opportunity to learn data science if you’re still a student or a graduate. To help you with your cause, here is our pick of the 8 best data science programs worth considering to go for: Data science certification programs.
The 8 best programs are available in the world to help you are
1 SAS CERTIFICATION
SAS Data Science Certification is an excellent option to go for. The prestigious certification requires a candidate to go through a rigorous certification process. The process is rigorous and rigorous and lasts a few months to several years. The SAS Academy for Data Science certification is a great way to get a better job or bagging a promotion, or enhance your existing skills.
2 DATA SCIENCE COUNCIL OF AMERICA (DASCA) SENIOR DATA SCIENTIST (SDS)
The Data Science Council of America (DASCA) Senior Data Scientist (SDS) certification program is designed for professionals with five or more years of experience in research and analytics. The program includes five tracks that will appeal to different candidates. Each track has different requirements in terms of degree-level, work experience and prerequisites to apply. The SDS is a multifaceted program that covers a wide range of professional knowledge. It’s recommended that students have knowledge of databases, spreadsheets, statistical analytics and SPSS/SAS.
3 CERTIFIED ANALYTICS PROFESSIONAL (CAP)
Certified Analytics Professional (CAP) is a vendor-neutral certification that validates your ability to “transform complex data into valuable insights and actions” A CAP exam costs $495 for INFORMS members, $695 for non-members. A CAP certification is valid for three years. You must pass the associate level aCAP exam before you can earn a CAP certification. The certification cost for a CAP is discounted for IN FORMS members. For more information, visit www.inFORMS.com/cap/.
4 SAS CERTIFIED BIG DATA PROFESSIONAL
The SAS Certified Big Data Professional is an extensive certification program that involves several real-world case studies and a total of 9 courses. To qualify for the exam, you’ll need at least six months of programming experience in SAS or another computer language. The certification exam includes Module 1: Big Data Preparation, Statistics, and Visual Exploration. The course covers SAS programming skills, working with data, improving data quality, communication skills, fundamentals of statistics and analytics, data visualization and popular data tools such as Hadoop, Hive, Pig and SAS.
5 CLOUDERA CERTIFIED ASSOCIATE (CCA) DATA ANALYST
The Cloudera Certified Associate (CCA) Data Analyst certification demonstrates your ability as a SQL developer to pull and generate reports in the CDH environment using Impala and Hive. During the 120-minute exam, you’ll be given eight to 12 customer problems with a unique data set and a CDH cluster. The exam is self-paced and tests your ability to analyze each question and then decide how best to “implement a technical solution with a high degree of precision”…
6 PROFESSIONAL CERTIFICATE IN DATA SCIENCE FROM HARVARD UNIVERSITY (EDX)

This Online Data Science Certificate Program is offered by Harvard University through the leading e-learning platform edX.
It includes 9 graduate-level courses that are taught by Harvard’s Professor of Biostatistics Rafael Irizarry and offered entirely online at a fraction of cost of traditional college. By the end of the program, you learn how to independently work on a data analysis project.
The courses begin with basic fundamentals and progress to culminate with a Capstone project where you apply the skills and knowledge acquired throughout the course series to a real-world problem.
7 SAS CERTIFIED DATA SCIENTIST
The Big Data Professional and Advance Analytics Professional courses combine with the other SAS courses. You must complete all of the courses and pass the five exams between the two.
You also learn how to work with data management tools and how to use data. The courses cost $180 per course and do not expire once you have completed the course and complete the course. The SAS Data Professional courses are available in the U.S. and Canada. You need to complete the full course to get the certificate and complete it.
8 IBM DATA SCIENCE PROFESSIONAL CERTIFICATE
The IBM Data Science Professional Certificate involves nine courses in data science, open-source tools, data science methodology, Python, data analysis, data visualization, machine learning, and a final applied data science capstone.
The program takes place online through Coursera with a flexible schedule and takes an average of three months to complete. There is no application process (anyone can sign up and start learning) and no prior knowledge of statistics or programming is required. The course includes hands-on projects to help you build a portfolio to showcase your data science talents.
Machine learning is an important aspect in data science the most popular machine learning algorithm is the decision tree.
Decision trees are a form of supervised learning, meaning that they require input data about what category an object belongs to in order to make predictions. The algorithm starts by splitting pieces of data from its training set into two groups based on some feature or label.
It then chooses the splits which maximize either information gain (entropy) or Gini index until all objects have been assigned to one group.
The final result is a tree structure where each node corresponds with a split and every edge has one or more predicted outcomes associated with it.
All of this may sound confusing without the context of real-world problems, problems which you will be more equipped to solve when you become a data scientist.
The great thing about data science certification is that it can be gained through self-paced online courses, such as those offered by Harvard University.
In fact, as a result of COVID-19 Harvard University offered a wide range of courses online for anyone around the world, through the e-learning platform edx.
If you are based in the Caribbean, don’t feel as though you are being left out. The aforementioned programs are available to all budding data scientists who want to dive into data analysis and data visualization.
Many people assume that they need to attend University for 3-5 years pursuing a degree in order to become a data scientist.
This is simply untrue. Many online courses and workshops offer a data science certification program that can explain applied data science without the burden of student debt.
Many online courses and workshops offer a data science certification program that can explain applied data science without the burden of student debt and full-time classes.
More data scientists than ever before are realizing that they need both hands-on experience and formal training if they want to succeed in this rapidly expanding field. Fortunately, there have never been more opportunities for people looking to pursue certification programs online.
Collaborating with a data scientist is not the same as being one, and these certifications can help you to differentiate yourself from your peers.
More data scientists than ever before are realizing that they need both hands-on experience and formal training if they want to succeed in this rapidly expanding field.
Online courses have become very popular because it doesn’t require taking time off work or giving up other commitments like family or friends.
Certificates also offer an opportunity for someone who already has a full-time job but wants to learn some new skills on their own schedule without needing to quit his/her current position!
Whatever stage you may be at in your data journey, Incus Services can help you.
With sound guidance from leading experts in the field, they will prepare you for your data journey step by step.
Take a look at how we help clients.
Financial and people analytics is the future of finance. They provide a deep understanding of how money moves through an organization, as well as insight into the human dynamics that drive it.
One of the things that financial and people analytics can do is help a Chief Financial Officer or someone in a senior management position understand their organization better by using data to identify strengths, weaknesses, opportunities and threats.
By implementing broad system improvements they can also make good decisions about how to prioritize resources on what’s important and allows the company to remain the leader and an example in the industry of good organizational operation and governance.
When you have this information at your fingertips, you can make better decisions for your company’s strategic direction, for budgeting and planning, for hiring new employees, or for making changes to existing ones.
In this blog post, we’re gonna discuss how you can use financial data, machine learning, and predictive analysis to optimize support decision making and strategic planning. In the age of technology, it’s important to remember that analytic tools can create business opportunities and address core problems within the financial team and by extension, the business.
By incorporating machine learning tools and predictive analytics, into your financial analysis strategies, you can stay ahead of the curve.
Machine Learning is a subset of artificial intelligence that uses algorithms to be trained on data sets in order to predict future outcomes. Predictive Analytics (from here on known simply as “analytics”) use mathematical models to understand patterns or trends.
As more companies and organizations begin recognizing the value of data and data analytics to business strategy, leadership, revenue generation, and performance, it is in the best interest of the finance employees, executives and auditors to embrace the global paradigm shift to data and analytics and its potential to provide insights and as industries remain forward-looking.
For the CFO, it is your responsibility to ensure that the company’s risk tolerance is balanced with profitability. Analytics can help you identify patterns in spending, detect fraud and uncover opportunities for cost savings or resource optimization.
It also helps to predict how a company might fare under a range of different circumstances, such as changes in interest rates or oil prices.
Data analytics can allow the finance manager to make decisions using big data that improve performance, sales, expenditure, and customer satisfaction.
And, with the right tools, management and finance teams can improve business performance through insights obtained in real-time.
Essentially, analytics allows the CFO to increase operational value and to improve the value chain through digital data-driven strategies in a cost-effective manner without compromising on quality.
When external auditors have to review finances from companies and organizations, the process can be a lengthy one. In some cases, an auditor may be on-site at a company for days or even weeks depend on the duration of time that the review covers.
Incorporating data analytics into the process can decrease that time allowing for the reporting to illustrate a deeper engagement with key business documents without losing countless hours of your life.
Data analytics in auditing can increase efficiency and provide the auditor access to the up-to-date, accurate, and reliable financial information that can be used for day-to-day operations at their company.
People analytics is a relatively new term that refers to the use of data and analytical techniques to better understand, predict, and optimize human behavior in organizations. People analytics is already being used by some organizations as a way to identify potential talent gaps through predictive analysis.
In addition, people analytics can be used for succession planning—identifying where future skills shortages may occur and can allow companies to proactively address those gaps.
Since people analytics is about understanding and optimizing human behavior, it naturally extends to how we recruit talent; there are now a number of tools that help companies identify potential candidates based on past performance and desired competencies as well as matching them with positions within the company where they would be most likely to succeed.

Using employee data is also intrinsic to making the most out of the skills that your workforce already possesses and can save time and money that would have been spent on outsourcing employees or hiring external companies and firms to provide the needed expertise.
This immediately turns into savings that can be redirected to improve the work environment for employees or to other areas which require economic injection based on the data-driven insights that you have obtained by combining financial analytics and data analytics together.
The beauty of people analytics is that it can be applied to customers and clients as well.
People analytics implemented by incorporating artificial intelligence and data analytics can help financial organizations, businesses and companies make better decisions about their customer base to promote sales and prevent losses.
This can be done by analyzing customer behaviors to find patterns such as which customers are likely to defect and provide potential tipping points for the company in terms of customer experience.

It also provides a more personalized approach which will help businesses keep their costs down while simultaneously maximizing profits from the business that they have.
This is because people analytics can use your data to predict outcomes in a fast and reliable way that takes some of the stress out of the process.
When your employees have consumer data in front of them in real-time:
All these changes can translate into financial results that accounting data and client transactions will undoubtedly reflect.
Regardless of whether your financial team is compromised of seasoned data experts or novices, there are companies and services which can work alongside your team to help. Advanced analytics and incorporating the right tools can allow finance leaders to gain greater insight in less time and helps departments that work in conjunction with finance function at their best.
Incus Services can help.
But the workshop is just the beginning. Consulting with Incus Services as part of your data improvement drive can make the difference between being a leading organization or falling behind the competition.
Incus Services can work closely with your organization to help your data talk to you and offer key insights. It is our objective to provide businesses with the machine learning and artificial intelligence strategies that they need to succeed.
Aren’t you ready to take your business to the next level? Why wait another moment to lead the finance sector through technology and digital transformation?
You’ve got the data and Incus Services has the expertise to help you remain long-term leaders in your field.
Here are some great finance analytics examples that you can model and implement in your own organizations.

Imagine a man who needs to roll a boulder up a hill. He gets close to the top but then the boulder slips out of his hands and rolls back down. The next day, he returns. He gets closer but his achievement is still beyond his reach. He hasn’t figured out what is keeping him back.
Data analytics has become the driving force of many industries. As more and more data is collected, the need for people with skills in this field will only grow. In this blog post, we will discuss why it’s important to use data analytics in the Caribbean, as well as how you can get started using them today!
This blog post discusses the importance of data analytics in the Caribbean, its potential impact across sectors, and provides tips for getting you started on your data analysis journey.

Data analytics is the process of collecting data, organizing it, and making sense out of it to create forecasts or make decisions. It helps us know what’s happening in a specific industry from point A to Z by having an understanding of all points in between. Essentially, it’s the practice of turning data into knowledge.
There are a few key points to remember when working with this field: data analysis will not provide you with answers, but they can help answer your questions and when we start looking at patterns and trends in our world, those insights allow us to make better decisions for everyone involved.
These insights are invaluable when it comes to tackling issues such as climate change, understanding social and economic trends, or improving public health.
In the Caribbean, for example, data analytics can play a key role in creating sustainable communities by helping us plan out new development projects that work with natural resources on the island instead of destroying them.
From this example, we can see that data analytics is potentially a powerful tool that can facilitate continuous assessment, support decision making, and help to identify opportunities for growth, expansion, and investment in the public and private sectors.
As data becomes more prevalent in our lives, it’s important to understand the power it possesses and what we can do with it. Data analytics is a vital tool for making sense of an overwhelming amount of information. It can be used to enhance customer experience, create new business models, and increase the efficiency of production processes – which allow organizations to engage in best practices that are guided by statistics and research.
When industries engage in data analysis, the possibilities are endless. Companies can use big data services offered by organizations like Incus Services to gain insight into the data that they already have. Using data collection, data mining, and analyzing findings can put companies on the right track to solving million-dollar problems. Depending on the industry, companies can use data to support the implementation of strategies, quality control or to improve marketing.
Businesses can use data as a powerful knowledge tool to gain insight into their operations, customer bases, to determine ways to improve online traffic to their website and storefront, and to identify where the demand for their product or service exists. Essentially, data analysis is the foundation for better decision-making and gives the organization the winning ability to stay ahead of the competition.
Universities can use data to target prospective students and to identify their areas of expectation. For the existing student population, it can be used to monitor performance in specific programs, and to gain knowledge about how to improve communication between students and administration.

Industrial companies can use data in many ways. Human resources can use data to ensure that employees are functioning at their best. Operations and engineering teams can use data to support various aspects of project management, monitor existing infrastructure and equipment, and ensure that processes are carried accurately and optimally.
Data can reshape how medical research takes place and can help pinpoint the ways in which health operations can be improved. It can assist in the creation of more targeted medication to meet the needs of specific demographics and can be used to regulate resources within public health institutions in an effective and efficient manner.
The environment is also included in the insights that data can offer. Data on weather patterns, water, and soil quality, and climate impact on various localized eco-systems can improve the overall quality of life in the region.
Caribbean data analytics can inform:

Acquiring the necessary skills to engage in data analysis has many benefits. For starters, data analytics is a growing field within the West Indies, and acquiring these skills might improve your chances of securing a job or increasing your value to your organization.
Having the expertise to analyze your own data without external input can allow you to generate reports faster and to develop solutions that reflect relevance to the specific issues knotted into a problem.
While data management and analysis may seem like a daunting task, the rewards outweigh the challenges you may face along the way.
Data provides the secrets that can influence management, operations, strategic implementation, and insights.
While we’ve only outlined some of the broad ways in which data can enhance your industry in this post, we’re only just getting started.
Stay in contact with us via social media and our website as we journey through the impact of data across a wide range of sectors and position its beauty and utility within the Caribbean context.
Come along with us, as we show you the magic of data analytics!
Data analytics is the future of business. What does this mean? It means that businesses are no longer relying on intuition and gut feelings to make decisions, but instead, they are looking at real-time data to understand how customers behave and what their long-term needs may be. This article will discuss how big data and business intelligence changed the business world and why we need to move along with it.
Data analysis has become a very popular and powerful tool for businesses. It is essentially the process of gathering data, analyzing it, and then taking action based on what you’ve found out about your customers. The more information that’s available to a company or business, the better decisions they can make; this applies to all aspects of business services including marketing strategies, sales efforts, and customer service. Along the way, as companies get to collect larger amounts of value-based detailed data, businesses are realizing how much value there is in being able to see big data, so as to understand their customer's needs better than ever before. Operating in this way allows them be more responsive and decisions based which leads directly to satisfy their needs even better than before!
Predictive analytics is a part of advanced analytics that’s used to predict future events.
One of the most powerful big data tools in a company’s predictive arsenal is data analytics. It may utilize many different techniques, such as data mining, statistical modeling, and customer-based analysis.
For example, predictive analytics may help analyze customer buying habits, which can assist marketing. Companies may use customer-related data such as purchase location and frequency of purchases in a fluid way in order to determine where customers are going and what services they may want next or need most urgently. This is a big data tool for businesses looking for new ways to stimulate sales growth and increase marketing value.
Companies that have successfully integrated data analysis into their business processes have reported increased profits by an average of 28%.
Yes, it is! It’s not only serious, it’s mandatory.
In the last ten years, business analytics has grown from a straightforward description of predictive and statistical tools to an umbrella term covering a dynamic spectrum of business intelligence and analytics. Various terms such as data analysis, data visualization, advanced analytics, machine learning, regression analysis, and data quality have bombarded the business world, especially marketing.
The future of business analytics is big data as well as statistics, used to develop markets, boost marketing, evaluate customer experience and optimize revenue streams.
For too long data analysis has been relegated to the realm of IT. There was a time when most executives in any business did not know what an analyst could do for them, let alone how they were able to make their lives easier by providing important and helpful insights into business performance. But now, much is changing as big businesses are starting to see the value of data analysis and a set of data which can help their social media.
With the rise of big data tools, society has revolutionized marketing and business intelligence. These actionable insights are made possible by complex data. Businesses that are changing and investing in big data will be better poised to reap the benefits of data analysis and increase the value of their business.
The answer is simple, all of them! Big Data Business Analytics has revolutionized every industry in every way possible, such as:

Big data has been incorporated into the education sector to help improve the overall experience of students. Institutions have been able to use data to better understand and address the needs of their students while also identifying trends and patterns that can be used to increase academic success. This may change education from being solely based on input and output statistics (i.e., grades) by having students learn what they need when they need it, instead of cramming everything together at the end of each semester. A recent study showed that when a student is given personalized feedback, they are more likely to improve academically. Remember, education is a business as well, the children are our customers.
Data has been a major factor for the transportation business as well, improving everything from fuel efficiency and routing precision, to identifying driver fatigue or distracted driving incidents in order to reduce accidents. In addition, this technology is being put into use by the construction industry with smart sensors on building sites capturing data about materials used and how long it takes them to install. This set of data is then fed back to project managers so they know when deadlines are missed or if projects need more resources allocated and where these should go based on the information collected.
Increasingly, companies are adopting data science for innovation purposes. With a wealth of raw data at hand, they can innovate by identifying influential factors that will drive future success metrics in order to maximize profitability or improve product quality within certain market segments. It is important for these companies to be able to capitalize on this opportunity as competition intensifies. For instance, with its new line-up of smartphones released recently (including iPhone SE), Apple has adopted machine learning algorithms developed through AI research division into all aspects of production including supply chain planning and procurement activities which resulted in more efficient manufacturing processes overall!
Data analysis deduced from big data was used to help conduct research on soccer teams, which helped identify their weaknesses and strengths in order to develop a winning strategy. By extension, this can also help sporting coaches better guide their athletes through the game.
In a 2016 study, Dutch soccer coaching organization KNVB experimented with big data to get real-time feedback about their players and regulate training sessions more effectively. They were able to use live tracking of athletes’ performances in matches via GPS devices and other sensors, aggregated by player position on the field, in order to measure how much effort they put into every movement while playing; this had previously been done manually through video footage analysis which was both time consuming and not always reliable due to subjective views from coaches or spectators.
Many governments have depended on data analysis for years, now they want for big data in business intelligence is just amplified. The UK, for instance, is even adopting big data tools to monitor and predict the spread of epidemics such as Zika. Furthermore, governments need hard statistical data in order to help shape policy that is sound and will actually have a positive impact on the intended audience.
Big data can even improve disaster relief efforts by helping organizations identify the most vulnerable populations, helping organizations understand how to best allocate resources, tracking and predicting natural disasters, creating a more efficient disaster relief system, and helping non-profit organizations understand what is needed in order for them to serve their communities.
Since data analysis is now being used to predict major global epidemics, the need for it in government will only increase. Data can be used to measure the effectiveness of policy and then change policies accordingly so that they are more effective at achieving their desired outcome. For example, a country may want to decrease illiteracy rates among children between age five and twelve by one percent every year until 2020; using evaluating big data on this goal would allow them not just to set specific goals but also track progress which would make sure the program was actually working towards its intended goal.

Analytics is helping insurers and companies evaluate customer behavior and optimize revenue streams as well as providing insights about disease prevention strategies that are employed by doctors and nurses alike. It’s also making it possible for hospitals to adopt and use individualized treatments based on the customer's patterns observed from big healthcare databases spanning millions of patients all over the world.
Big data can be used in the customer service sector for a business like Uber or Airbnb that relies on reviews from customers as part of their decision-making process when hiring drivers or vetting new hosts.
By adopting big data analytic techniques such as clustering analysis these types of businesses can identify big patterns among different groups of people who will provide them with valuable insight into what will most please each group while avoiding potential problems before they occur. This type of information would not only help fulfill current demand for companies but could also predict future demand for services.
It is no longer a question of whether big data will change the business world, but instead, we are now entering an era where companies can’t afford to employ big data technologies in their decision-making strategy. With so much information available coming from all sorts of sources, it’s important that big businesses invest in predictive analysis with large volumes of data which could provide them with valuable insight into what might happen next on many levels.
The first step towards employing these methods should be understanding your own company’s goals and objectives before building out any type of big data technology solution. This way you don’t become overwhelmed by the vast amount of options or waste time trying to figure out the right cost or changing objectives while others get moving and find success.
It is an emerging technology that is changing the way people work and transforming industries. Artificial intelligence processes data using machine learning algorithms to find patterns in large sets of unstructured information (big data).
The goal AI is to transform big data into insights about real-world problems. An example: an algorithm could be used by a medical researcher who wants to discover drug treatments for heart disease; it can analyze different types of research papers on cardiovascular health and suggest articles based on these findings which might otherwise go unnoticed.
Artificial Intelligence provides us with many opportunities including better customer service, more accurate forecasting, improved national security, increased productivity, and faster innovation in business, among others.
There are also risks which may be associated with this new tech as well such as increased surveillance and loss of privacy.
The future is now as big data and AI technologies develop exponentially to meet this demand. With predictive insights such as these, big companies can anticipate changes in their markets and create strategies accordingly with more confidence than ever before.
This technology empowers business intelligence analysts by providing them with deep analysis that would be difficult or impossible without access to vast amounts of big data which show patterns emerging from past behavior which could not have been predicted through simple linear extrapolation methods alone (such as trend lines). These advanced analyses are making it possible for big businesses to use these tools and identify trends earlier on, adjust courses before they become a problem, and maximize.
Data mining is a technique that extracts insights about the data from a large volume of raw and unstructured information.
It is an exploratory search for patterns in sets of structured or semi-structured data by adopting different techniques, some novel, others borrowed from statistics, machine learning, or database systems.
When relevant big data techniques are put to use to provide statistical analysis, the process may generate new hypotheses as well. This can be done using data from a wide range of sources, such as social media or customer experiences.
Data Mining makes it possible for businesses to identify trends sooner on and adjust course before it may become a big problem. Data mining also maximizes the data that is collected so that more information can be gathered from less of an input, in order to help reach as many conclusions about the business strategy, even make the right decisions when possible.
In this sense, data mining enhances any decision-making process by adding valuable insights into how customers think and respond to products or marketing campaigns.
Once a pattern is found, it may suggest the type of additional analysis necessary, or provide an early indication that there is something going on and needs investigation. These suggestions are golden, as they can save a lot of time and effort by narrowing down the path to explore.
Big Data-driven transformation is not a new trend. In fact, this information may be around since the beginning of civilization as we know it; but until now, digital transformation might have seemed like an impossible dream and an unattainable goal to many in our region, with few big data-driven projects, underway or completed.
In the Caribbean, Antigua & Barbuda is an excellent example of forward-thinking data interaction in the region, as they are set to become the first Caribbean future island nation. The government has put forward an initiative to digitize data, then use the data to make sense of policy. The data may then be used efficiently to see patterns and trends, or where they may be falling short. This will ideally help the country run much more efficiently.
Antigua & Barbuda has taken an initiative to invest in big data analytics and data visualization in order to understand their own policy needs better than ever before. They have understood the benefits of treating their people like the customer and marketing big data on a wide scale. This may be revolutionary!
Digicel, the mobile phone network and home entertainment provider, has been working hard on developing partnerships with other organizations that are experts at data analysis so that they can offer better services to their customers while still maintaining a competitive edge over other providers in the region. Digicel is simply one example of how big data and customer-centered analytics may be employed as an opportunity for economic growth throughout the Caribbean.
One common mistake people make when utilizing big data analytics is neglecting qualitative analysis or traditional market research techniques like surveys because they think there’s too much information available from digital sources such as social media. But it’s called big data for a reason, all data is important to understanding the perspective of your customers because the customer is always right.
The Caribbean is one of the most dynamic places in the world. Entrepreneurs are creating new opportunities, and governments must invest in digital transformation which involves heavy emphasis on big data analytics for the future. The focus on innovation and inclusion is shifting mindsets to create sustainable economies that will fuel growth for decades to come.
Placing an emphasis on the importance of big data analytics is just one indicator of a larger trend, but have no doubt, data analytics is going to be one of the most lucrative markets in the world. The continued use of advanced data techniques in business and technology will improve the demand for future business analysts.
Is your organization data-driven? It’s the year 2021, and if you are an executive, then it may be time to start thinking about what skills will be most beneficial to your company and its future. If you haven’t already done so, now is the time to think about how technology will change the way we work. The rapid pace of technological advancements creates constant pressure on companies that can create significant opportunities as well as threats.
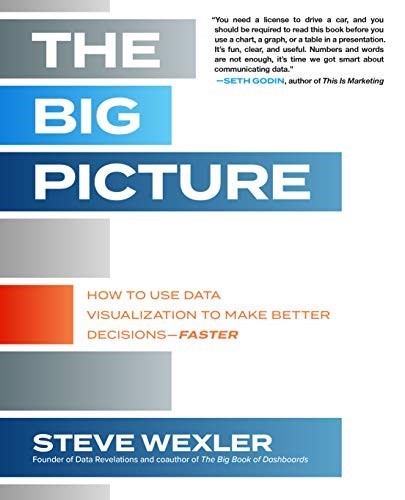
To help executives make sense of these changes, Steve Wexler’s The Big Picture: How to Use Data Visualization to Make Better Decisions Faster shares practical advice and key insights into where companies should focus their attention in order to succeed in this new world using the data they already have. Whether the organization uses Tableau or Power BI, this book is a one-stop resource that empowers you along your data journey.
Read to the end to figure out how you can begin to paint your own big picture with data.
The big picture helps professionals whether you are a CEO, chief marketing officer, chief analytics officer, chief research officer or even a data detective or data expert. It enables business professionals to make critical business decisions based on key insights and to use their data visualizations quickly and effectively.
On Tuesday morning I was interrupted by FedEx. Presented with a package that bore a strange name, I was skeptical and almost sent the courier back, until I spotted McGraw Hill on the packaging. Realizing it was a book, I decided to take it. When I opened it up, I was like a child on Christmas morning. It was Steve Wexler’s The Big Picture: How to Use Data Visualization to Make Better Decisions Fasterand I immediately dove in.
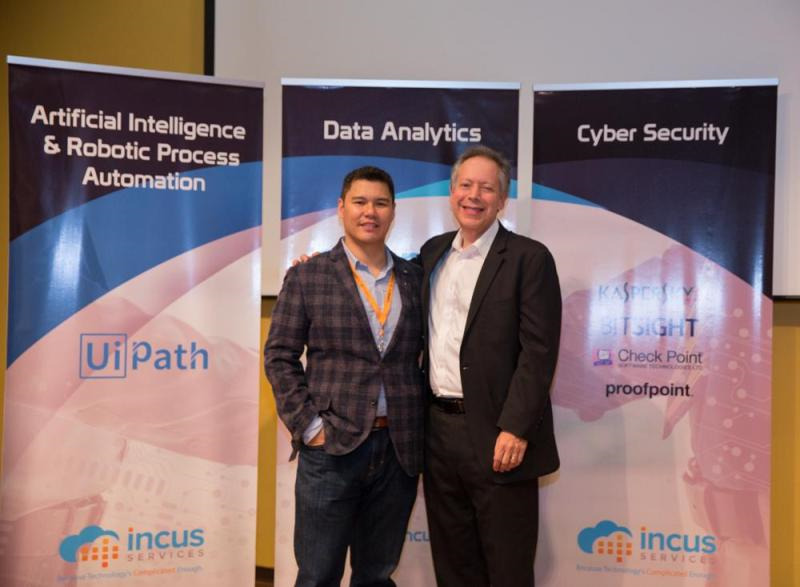
LESLIE LEE FOOK & STEVE WEXLER AT THE ARTHUR LOK JACK GRADUATE SCHOOL OF BUSINESS
Steve Wexler is no stranger to data visualization or data visualization consultancy in both academic and professional contexts and provides essential data literacy lessons through his publications. These insights help business professionals achieve their data goals. Just like his previous book, The Big Book of Data Dashboards, this new publication contributes to the global data culture to transform data into insights that can assist every business leader and inspire next generation leadership. It is apparent that Steve Wexler’s passion is promoting graphical literacy and helping everyone to become a data expert and transform data into solutions.
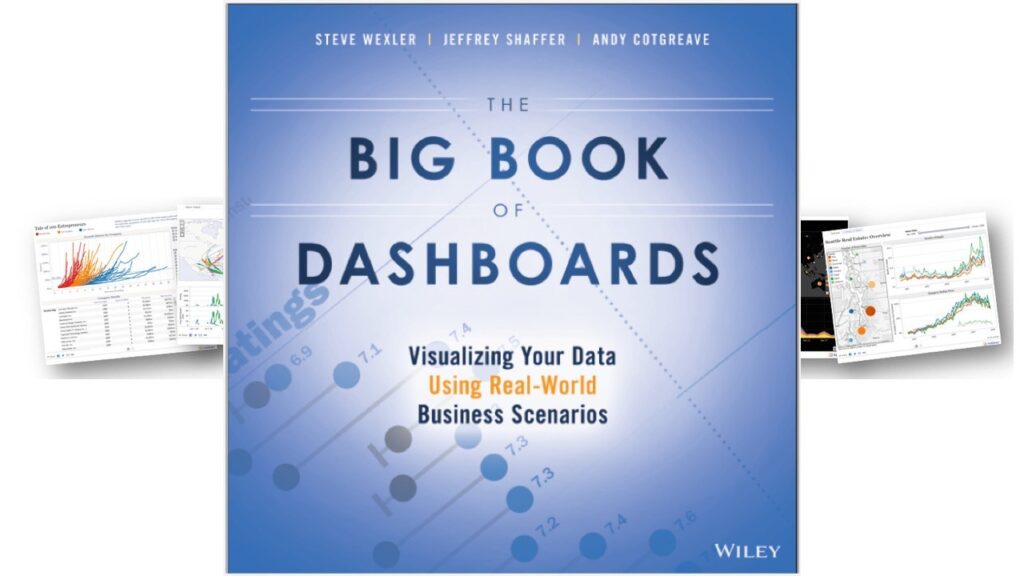
STEVE WEXLER’S LAST PUBLICATION, THE BIG BOOK OF DASHBOARDS
Steve Wexler’s book resonated with me on so many levels as he identified problems and proposes methods to solve problems that are common in the data visualization stratosphere that I have often encountered and tried to articulate to workshop attendees, clients, and everyone who needed to use their data better. My excitement at the concept of this book immediately transferred to my interaction with its content. Wexler communicates with readers at any level they enter his book making data accessible and begins with a call to change the ways they look at data. Yes, we have the numbers on spreadsheets, but so what?
Wexler encourages his readers to look not at the figures themselves but learn to speak to/with the data, that is to practice graphical literacy. He highlights the importance of being able to decipher our data after it has been visualized. Thereby turning spreadsheets into solutions. This process effectively turns visualization from representation into intelligent conversations, one that begins with Steve Wexler and his reader and continues between the reader and his/her data.
Steve continues by engaging and entertaining guide by inviting his readers to consider more nuanced ways of examining data and conducting visualization and analysis that proves to be suitable for both the data analytics virgin and the Excel expert. From the arrangement of charts to the use of color, Wexler illustrates through his own work how to take your data from uninteresting, to intriguing.
He also delves into the importance of storytelling with our numbers and demonstrates that beautiful graphs can be created not only for those who are trained in visualization but by anyone willing to do a little bit of learning. Communicating data effectively is key in today’s world.
Wexler has created a book that is not only an educational guide but also satisfies the need for storytelling. The author’s engaging conversational style makes this an enjoyable read while still providing valuable insights about how we can take what is often considered boring data and transform it into a story that can be shared to derive deeper insight. More importantly, it’s a guide to constructing a narrative of improvement and corporate transformation for organizations that apply these strategies.
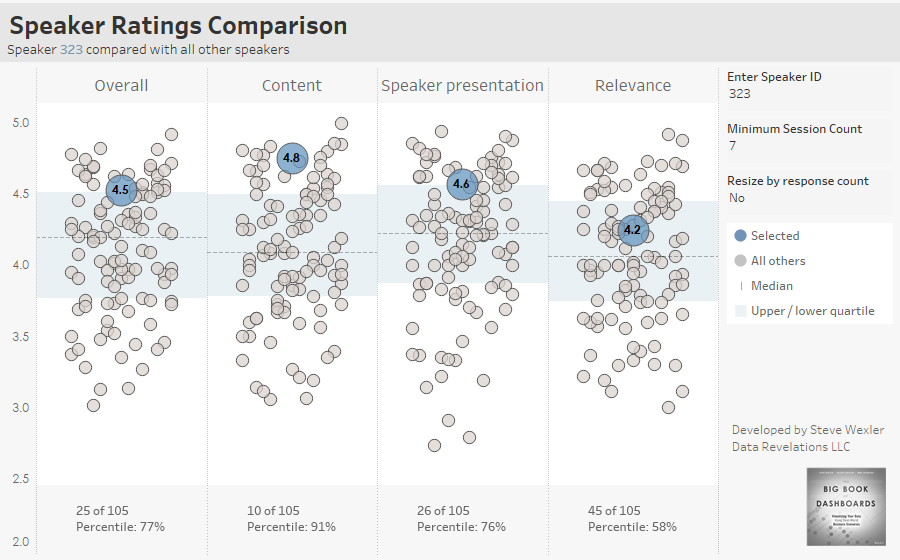
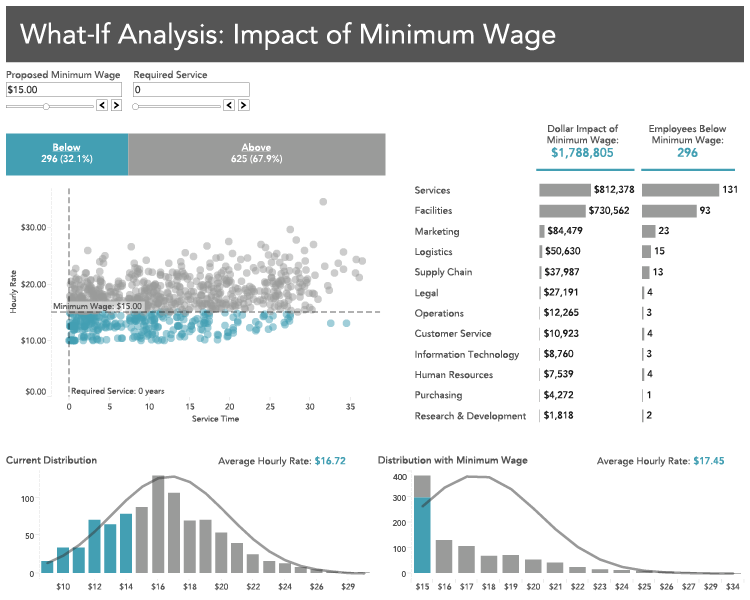
To contextualize the nuggets of wisdom throughout this book, Wexler’s use of real-world data driven cases is a welcome addition. The book presents examples that are related to the data analysis techniques he discusses, which helps readers to better understand the purpose behind his visualization and interpretational techniques.
This allows the reader to see how these strategies can be applied in their own work-related scenarios and to help them uncover issues that previously went unnoticed or unresolved due to the poor application of data to persistent problems.
The fleeting nature of time is always a concern to those who analyze data. When presented with raw data countless hours are spent cleaning, creating, and comparing data sets. This is where Wexler’s book offers a much-needed solution to the woes of analytical professionals everywhere- he helps them make sense out of seemingly endless nights spent with their noses buried in spreadsheets.
He also debunks the myth that the tasks involved in data analysis are to be done in isolation. He gently nudges the reader to be open to opportunities for collaboration not just to make task completion easier but for the insight that multiple perspectives can bring to the process of interpretation.
The book is clearly written and accessible to any high-school graduate. It offers a guide for the beginner in data visualizations while also including aspects of theory that will interest more seasoned professionals. Wexler has managed, in his short expository text, to rekindle enthusiasm for an industry which on the one hand is often viewed as tedious yet on the other hand is key to understanding greater patterns in society.
This is a good book for every data scientist and business professional looking to improve their ability to understand the true story behind spreadsheets. I often see so many instances of data scientists who can see the trends but cannot adequately convey the implications of this content from their graphs and dashboards. It enables business leaders to engage in effective interpreting and drawing insights from
Wexler’s book has found its niche in these moments. It teaches us to not be focused on the numbers and what they represent in spreadsheets and bar graphs but rather on the big picture that these numbers paint to influence critical business decisions.
Steve Wexler delivers his titular promise of providing solutions to using data in a faster and better way and guides you along the process of building solutions in the aftermath of building data dashboards. In the spaces between words, Wexler beckons to the reader, “Come along, and paint your own big picture. I will show you how.”
To start creating your own big pictures with data, check out Steve Wexler’s The Big Picture.

The sophisticated supply chain attack that is dubbed “Operation ShadowHammer” has compromised one of ASUS’ servers which is used to provide updates via the ASUS Live Update utility tool.
Researchers at Kaspersky Labs had uncovered the attack in January 2019 however, investigations are still in progress and full results and technical papers will be published during SAS 2019 conference in Singapore.
ASUS Live Update is an utility that is pre-installed on most ASUS computers and is used to automatically update certain components such as BIOS, UEFI, drivers, and applications. According to Gartner, ASUS is the world’s 5th-largest PC vendor by 2017 unit sales. This makes it an enticing target is given the size of their userbase.
Kaspersky has reported that over 57,000 Kaspersky users have downloaded and installed the backdoored version of ASUS Live Update at some point in time and the malware was estimated to have affected over half a million ASUS users using other antivirus software.
The hackers gained access to the ASUS Server and were able to fraudulently sign the trojanized malware files using an authentic ASUS digital certificate.
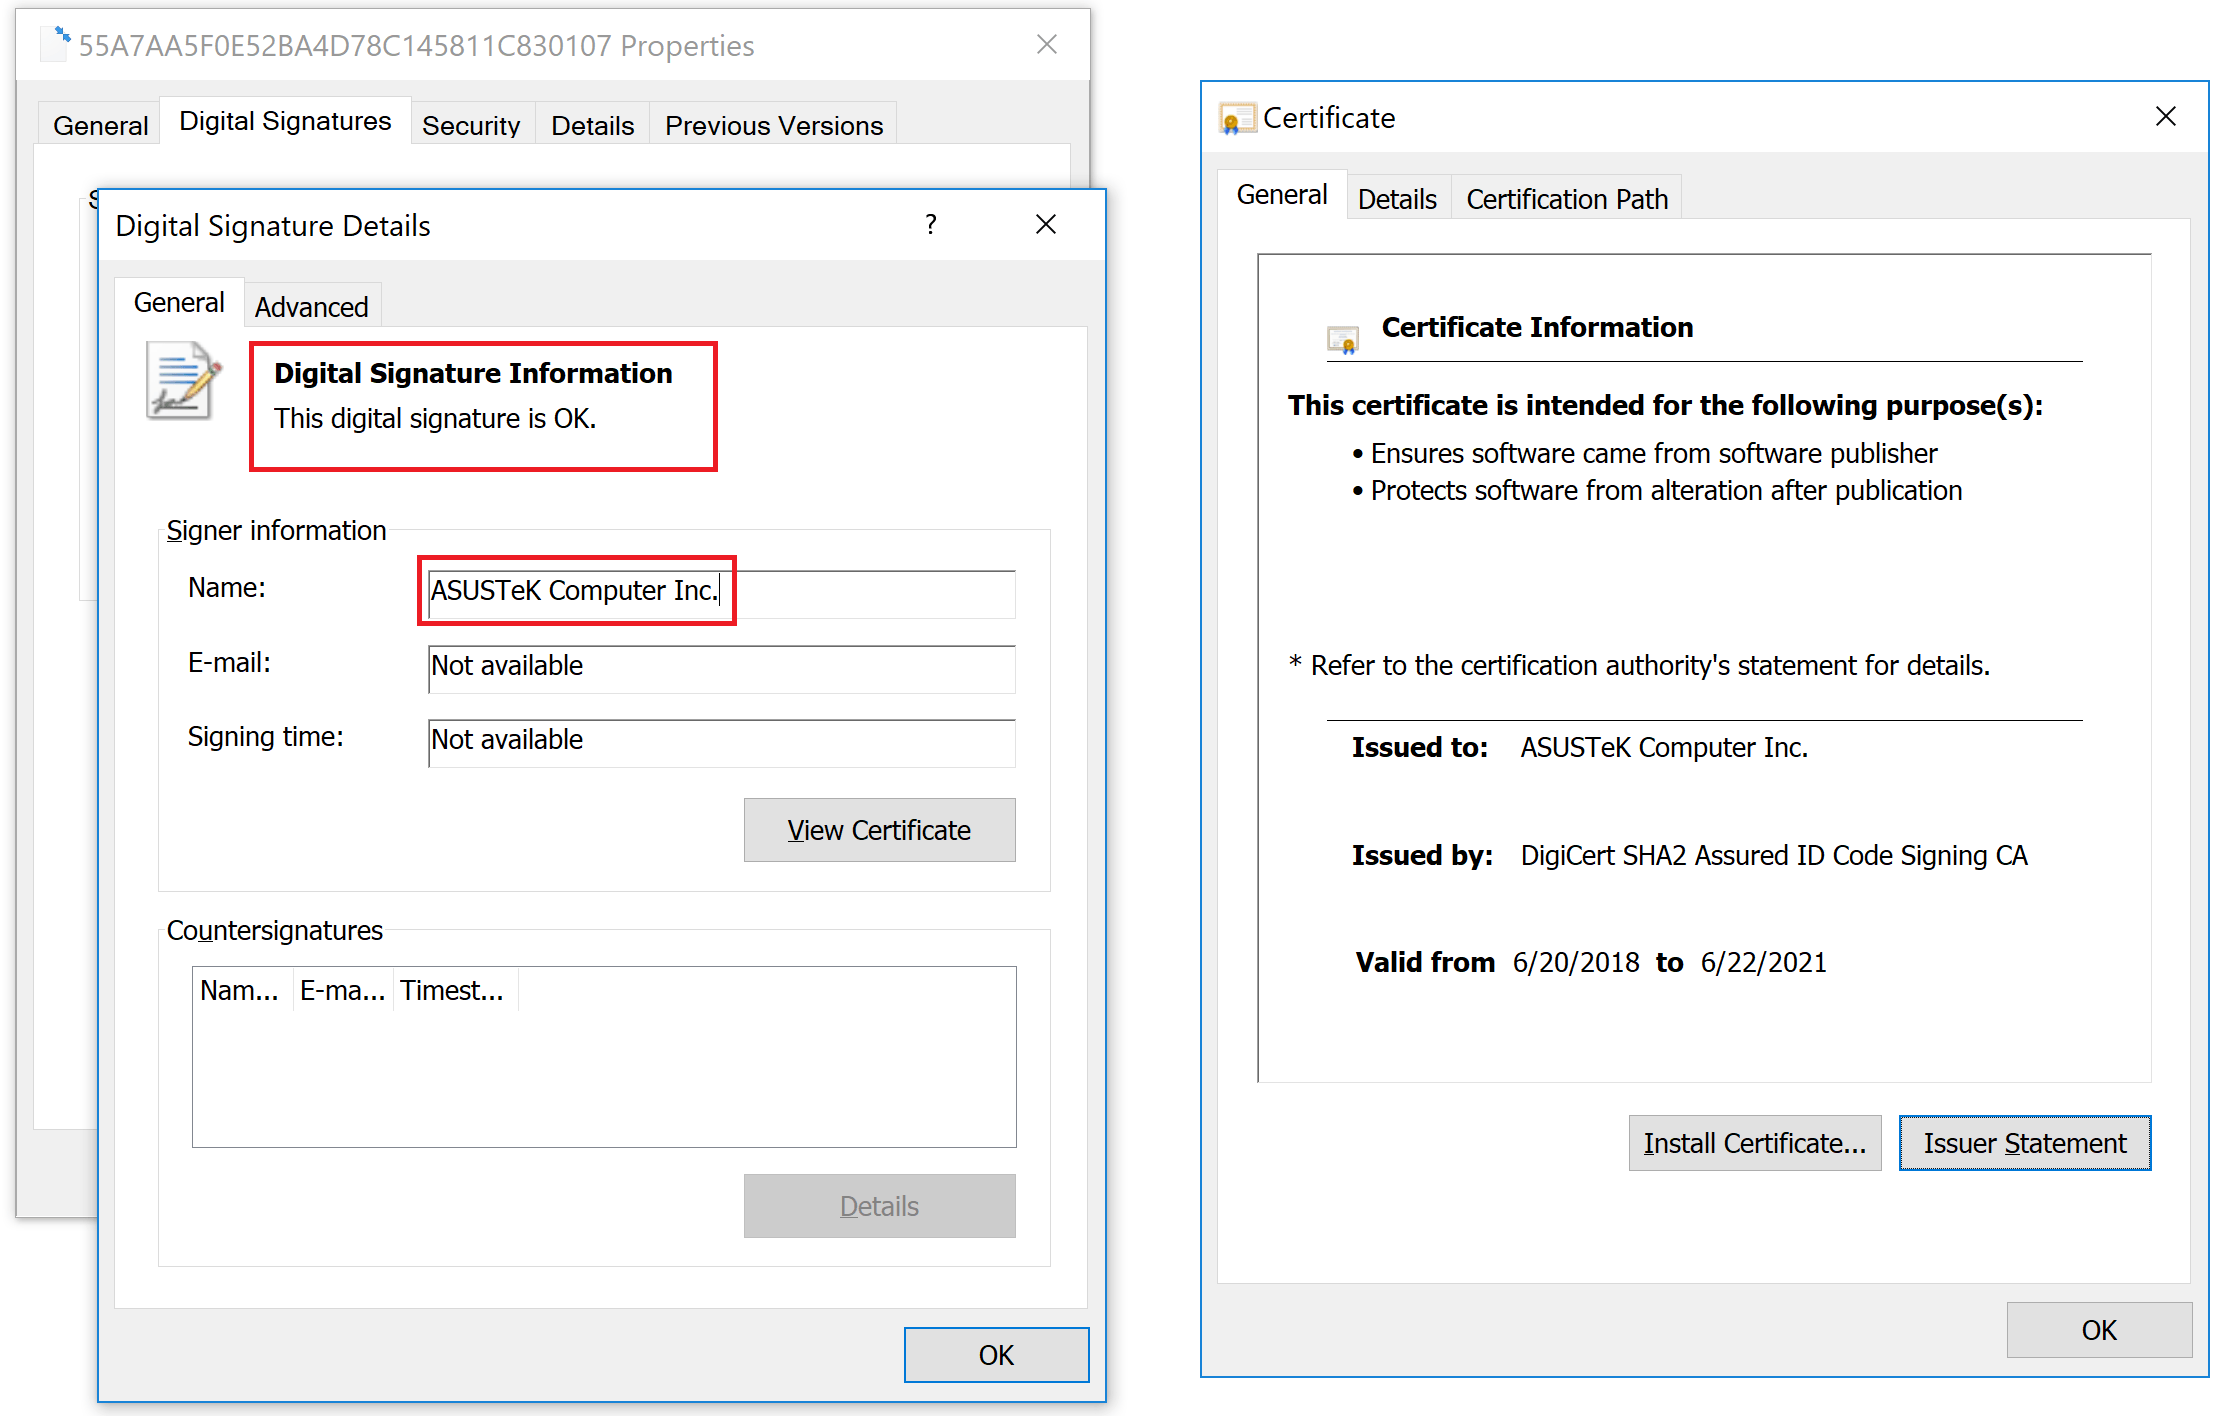
Digital signature on a trojanized ASUS Live Update setup installer
The malware targeted an unknown pool of users, identified by their network adapters’ MAC addresses but some evidence collected by Kaspersky correlated the attack to the ShadowPad attack in 2017. The perpetrator behind ShadowPad has been publicly identified by Microsoft in court documents as BARIUM. BARIUM is an APT actor known to be using the Winnti backdoor.
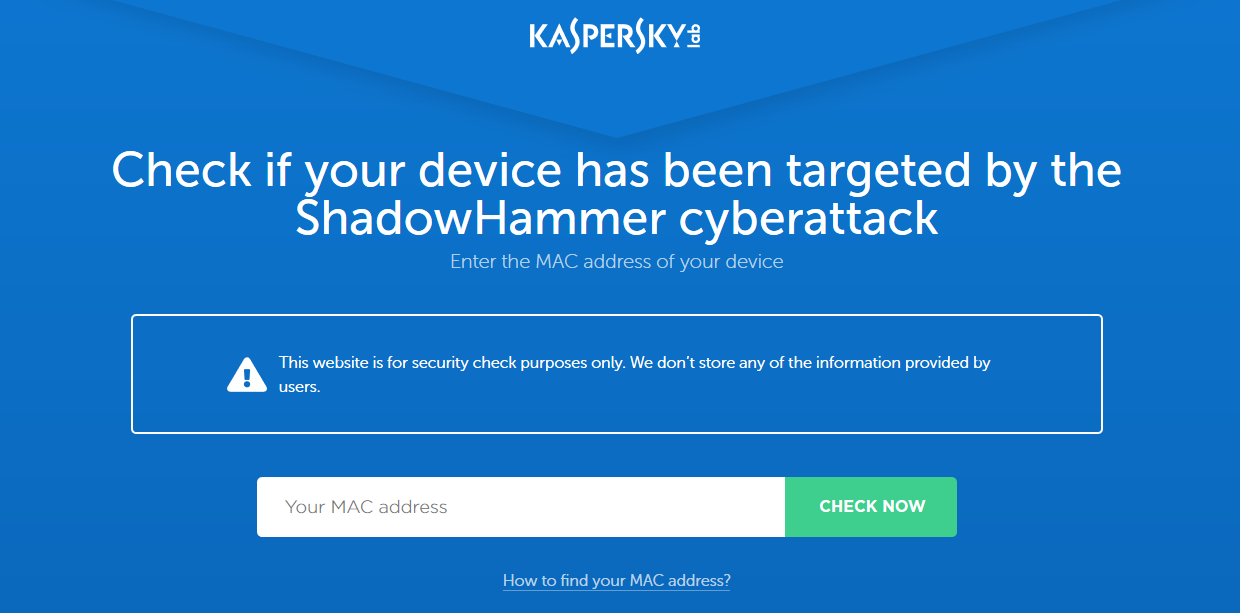
As a result of this attack, Kaspersky Labs has created a tool that can be run to determine if your computer has been one of the surgically selected targets of this attack. To check this, it compares MAC addresses of all adapters to a list of predefined values hard-coded in the malware and alerts if a match was found.
Download an archive with the tool (.exe)
Also, you may check MAC addresses online. If you discover that you have been targeted by this operation, please e-mail us at: info@leslieleefook.com.
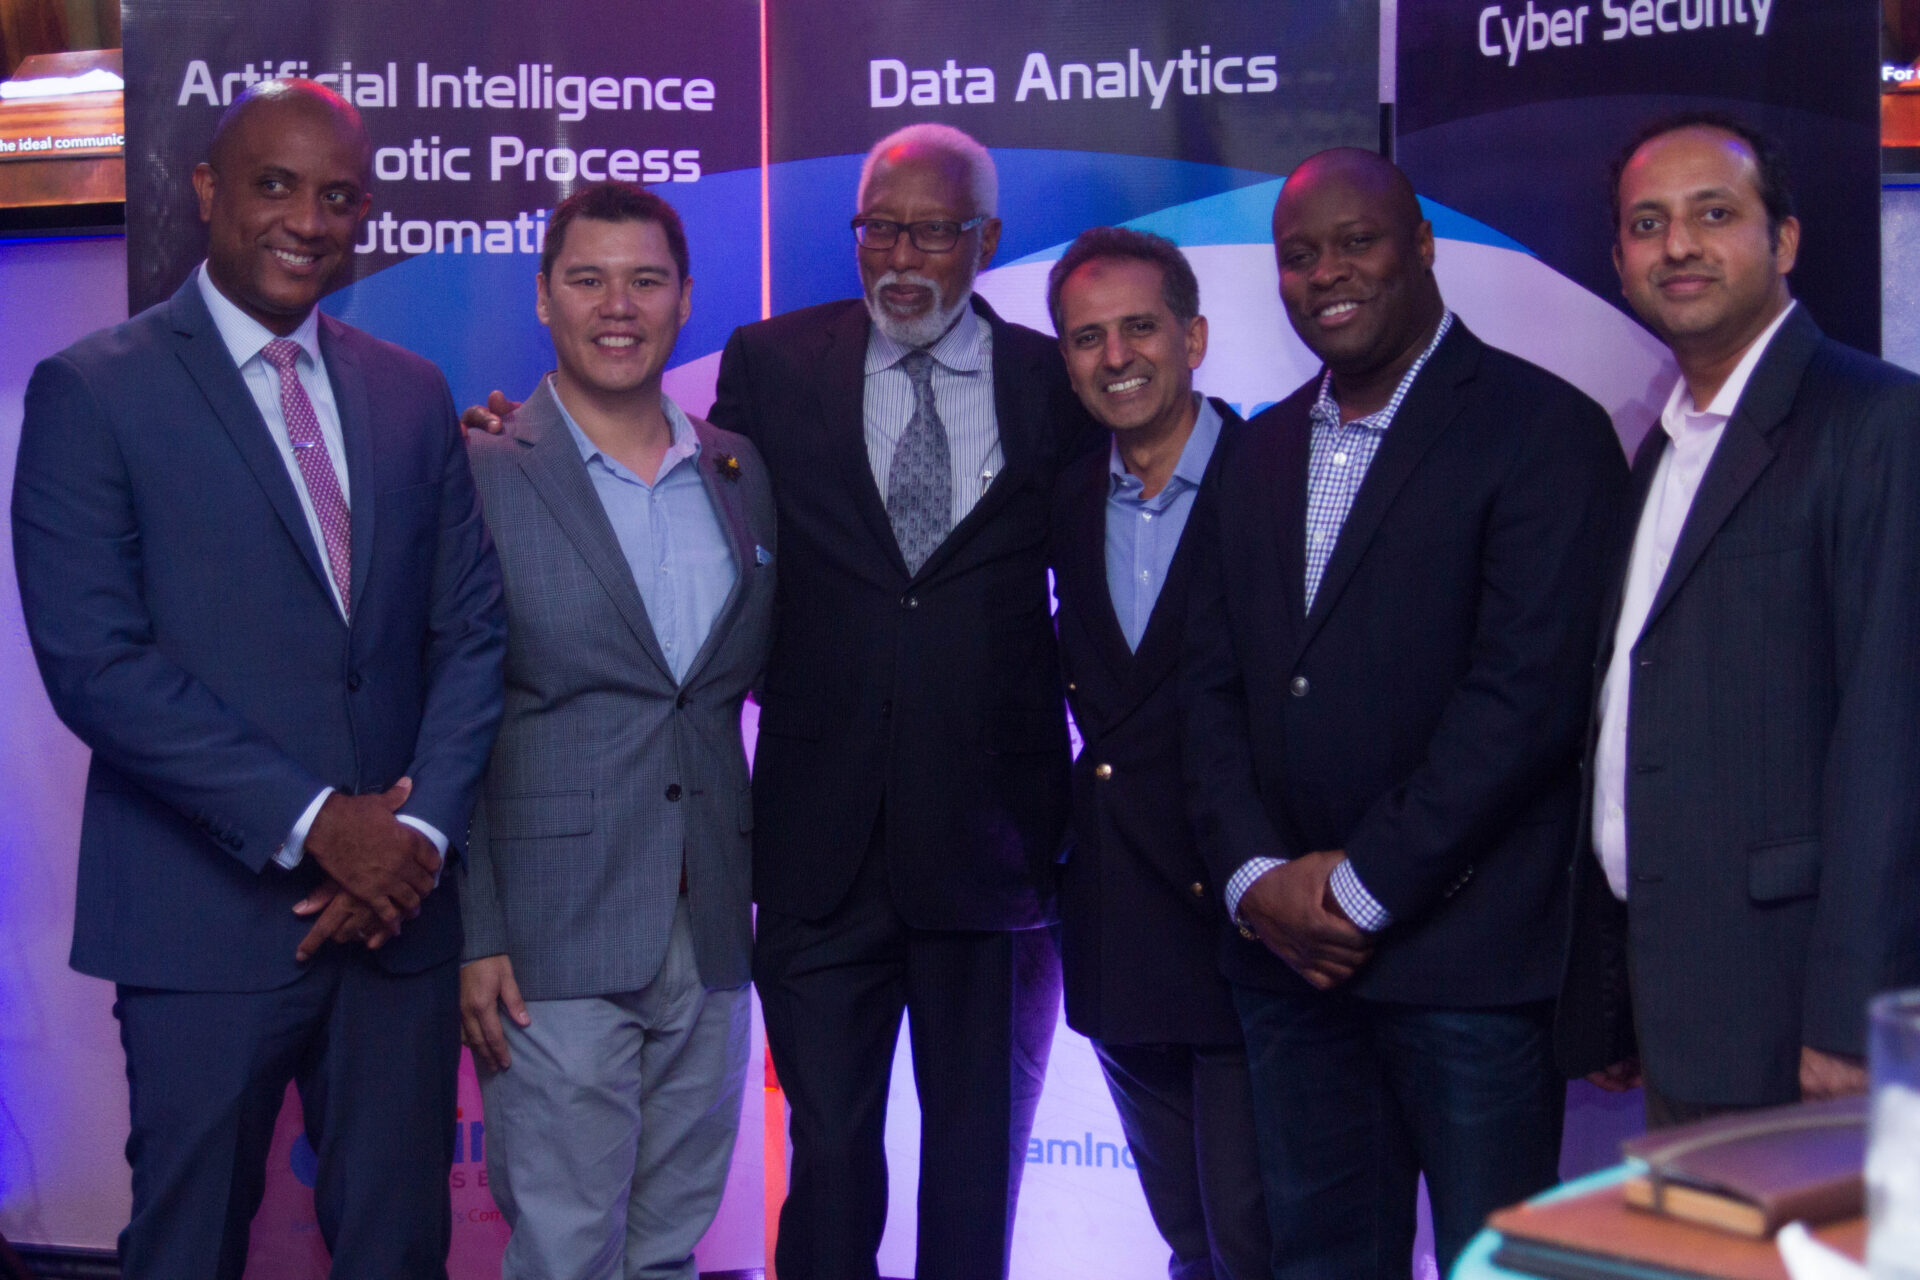
Since the inception of Incus Services, we’ve truly recognized the power of data to transform everything when it’s properly collected, analyzed, and understood. It was our honor to host an event with speakers who share the same vision as we do – using data to create a better future.
Our speakers included Mr. Naveen Bhat, Senior Regional Director of CrimsonLogic Pte Ltd. who commenced the evening by sharing CrimsonLogic’s plans for developing Smart Nations, to benefit citizens in areas such as mobility, public safety, health, and productivity. He noted that Singapore is currently the world leader in all these categories and is well on its way to becoming the first Smart Nation.
Mr. Kirk Henry, CEO of iGovtt also shared his vision for a Smart Trinidad using disruptive technologies such as analytics, robotic process automation, and artificial intelligence. His presentation was followed by Mr. Joel “Monty” Pemberton, CEO of DeNovo Energy, Trinidad’s first local gas producer. He presented the company’s ongoing evolution for sustainability in the natural gas industry and how technology is enabling its mission.
Our feature speaker Mr. Maurice Barnes, CEO of eGov Jamaica Ltd, provided insights into the journey of Jamaica to becoming a digital society, a concept that is similar to a Smart Nation. Mr. Barnes explained that the foundation of this society is a digital government, a framework that enables open and user-driven governance. He shared the components of e-Jamaica which include four tiers:
Mr. Barnes was also proud to announce that Kingston was well on its way to becoming one of the first Smart Cities in the Caribbean.
Our final speaker, Director of Incus Services, Mr. Leslie Lee Fook, put forward a brief thought-provoking question to the attendees: “What is your number?” He expressed his vision for a united Caribbean community enabled by technology to withstand the forces of digital disruption. He intends on raising awareness and helping the Caribbean population of 43 million-plus people (that’s his number) to recognize the opportunities for collaboration to foster a technology-driven region. Mr. Lee Fook urged everyone to find their niche in their respective industries to challenge the status quo and reach for operational excellence through data-driven decision-making and embracing disruptive technologies.
We are incredibly grateful to these speakers who all share the vision of a better, data-driven future, for participating in our event which would not have been successful without all of the amazing individuals who also took the time to attend. Incus hopes that each attendee is now motivated to be an agent for digital transformation in their various industries for 2019.
Here’s to a Merry Christmas, a Revolutionary 2019!

Director of AI, Automation & Analytics, Leslie Lee Fook, at RedVUCE Conference 2018.
RedVUCE – The Inter-American Network of International Trade Single Windows is a regional forum established in 2011 for dialogue and cooperation by governmental, public, and private organizations. It is responsible for the design, development, and administration of electronic trade single windows for countries in the Americas. The forum’s main objective is to promote the use of trade single windows to support and facilitate trade. They aim to integrate single windows and encourage electronic data exchange in the region.
This year’s conference highlighted the recent strides made in driving transformation across the region and facilitating trade.
Incus’ Director of AI, Automation, and Analytics, Leslie Lee Fook was granted the prestigious honor of speaking at RedVUCE and informed the conference of opportunities for utilizing trade data from our single window, TTBizLink, to answer trade questions, specifically around Trinidad and Tobago’s position as global ammonia exporters.
Leslie also expressed that the problems that are faced in the Caribbean are not unique to any one country or the territory itself but instead present the space for creativity and collaboration to come up with solutions that are viable globally.
His message was well-received by the participants.

A Two-day Workshop delivered through Tertiary Education Institutions
How do you know that the food or drink you’ve prepared tastes good? You taste it yourself. That’s our policy at Incus. Whatever we recommend to our clients, you can bet that we’ve tested and proven it internally so that the results speak for themselves.
Our course Data Analytics for Non-Technical Professionals is no exception to this. On August 11th and 18th we recruited our staff for a full trial run of our workshop. They generously volunteered two Saturdays to learn and objectively critique the content and delivery of the course.
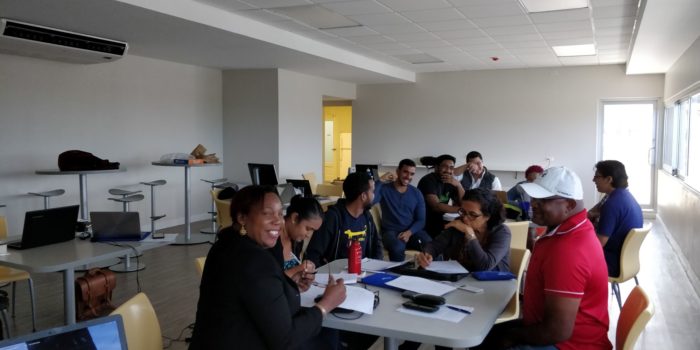
The first session kicked off with a lively practical introduction to fundamental concepts using the data analytics software. Topics covered included:
The second session was equally exciting with loads of healthy discussion and a whopping dose of competition as the room was divided into smaller groups for thought-provoking exercises. The content delivered included:
The feedback offered by the participants at the end of the two sessions was incredible and instrumental in refining and tailoring our course to deliver as much value as possible to our future audiences. We look forward to sharing our program in the following months with non-technical professionals and changing the data analytics landscape across the Caribbean towards a data-driven culture.
For further information on our workshops and training sessions visit the Events section of our website or contact our marketing lead Nateesha Gajadhar via email at nateesha@leslieleefook.com or call us on 222-5683.